OpenCV半小时掌握基本操作之分水岭算法
目录
- 概述
- 分水岭算法
- 距离变换
- 连通域
- 分水岭
- 代码实战
【OpenCV】⚠️高手勿入! 半小时学会基本操作 ⚠️ 分水岭算法
概述
OpenCV 是一个跨平台的计算机视觉库, 支持多语言, 功能强大. 今天小白就带大家一起携手走进 OpenCV 的世界.

分水岭算法
分水岭算法 (Watershed Algorithm) 是一种图像区域分割算法. 在分割的过程中, 分水岭算法会把跟临近像素间的相似性作为重要的根据.

分水岭分割流程:
- 读取图片
- 转换成灰度图
- 二值化
- 距离变换
- 寻找种子
- 生成 Marker
- 分水岭变换
距离变换
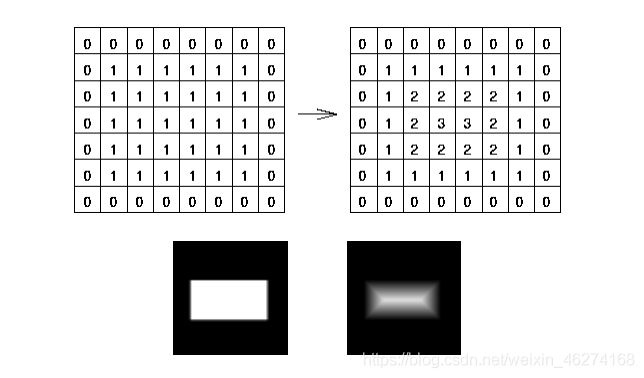
距离变换 (Distance Transform)通过计算图像中非零像素点到最近像素的距离, 实现了像素与图像区域的距离变换.

连通域
连通域 (Connected Components) 指的是图像中具有相同像素且位置相邻的前景像素点组成的图像区域.

格式:
cv2.connectedComponents(image, labels=None, connectivity=None, ltype=None)
参数:
- image: 输入图像, 必须是 uint8 二值图像
- labels 图像上每一像素的标记, 用数字 1, 2, 3 表示
分水岭
算法会根据 markers 传入的轮廓作为种子, 对图像上其他的像素点根据分水岭算法规则进行判断, 并对每个像素点的区域归属进行划定. 区域之间的分界处的值被赋值为 -1.

格式:
cv2.watershed(image, markers)
参数:
- image: 输入图像
- markers: 种子, 包含不同区域的轮廓
代码实战
import numpy as np
import cv2
from matplotlib import pyplot as plt


def watershed(image):
    """分水岭算法"""

    # 卷积核
    kernel = cv2.getStructuringElement(cv2.MORPH_RECT, (3, 3))

    # 均值迁移滤波
    blur = cv2.pyrMeanShiftFiltering(image, 10, 100)

    # 转换成灰度图
    image_gray = cv2.cvtColor(blur, cv2.COLOR_BGR2GRAY)

    # 二值化
    ret1, thresh1 = cv2.threshold(image_gray, 0, 255, cv2.THRESH_OTSU)

    # 开运算
    open = cv2.morphologyEx(thresh1, cv2.MORPH_OPEN, kernel, iterations=2)

    # 膨胀
    dilate = cv2.dilate(open, kernel, iterations=3)

    # 距离变换
    dist = cv2.distanceTransform(dilate, cv2.DIST_L2, 3)
    dist = cv2.normalize(dist, 0, 1.0, cv2.NORM_MINMAX)
    print(dist.max())

    # 二值化
    ret2, thresh2 = cv2.threshold(dist, dist.max() * 0.6, 255, cv2.THRESH_BINARY)
    thresh2 = np.uint8(thresh2)

    # 分水岭计算
    unknown = cv2.subtract(dilate, thresh2)
    ret3, component = cv2.connectedComponents(thresh2)
    print(ret3)

    # 分水岭计算
    markers = component + 1
    markers[unknown == 255] = 0
    result = cv2.watershed(image, markers=markers)
    image[result == -1] = [0, 0, 255]

    # 图片展示
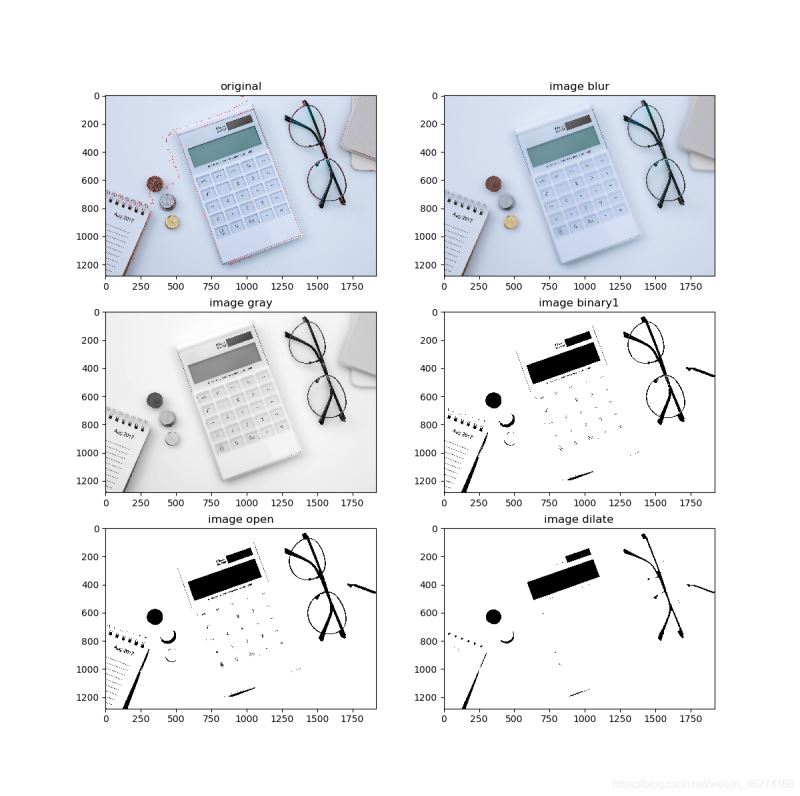
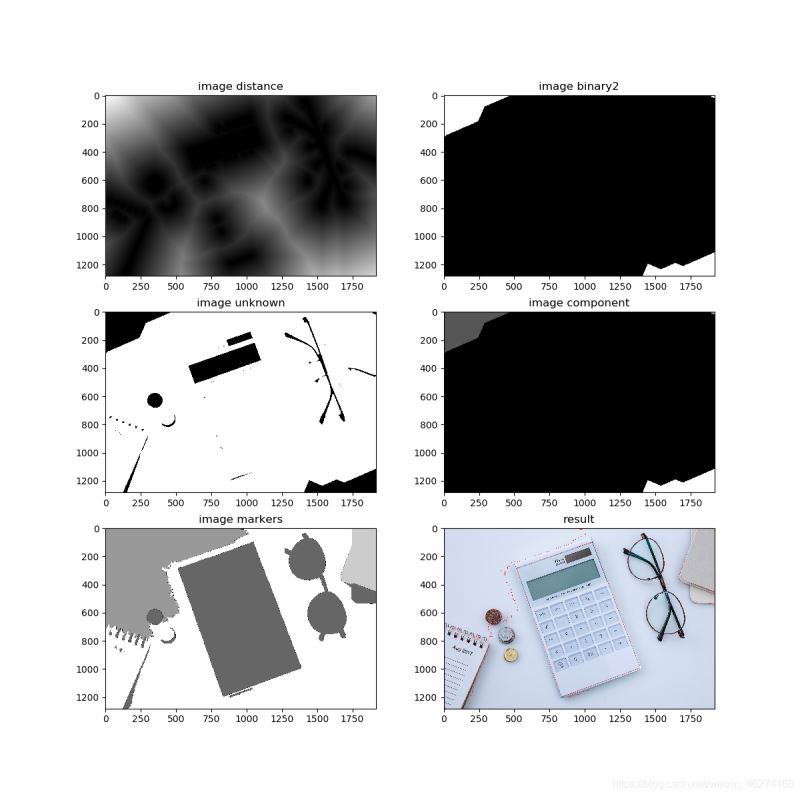
    image_show((image, blur, image_gray, thresh1, open, dilate), (dist, thresh2, unknown, component, markers, image))

    return image


def image_show(graph1, graph2):
    """绘制图片"""

    # 图像1
    original, blur, gray, binary1, open, dilate = graph1

    # 图像2
    dist, binary2, unknown, component, markers, result = graph2

    f, ax = plt.subplots(3, 2, figsize=(12, 16))

    # 绘制子图
    ax[0, 0].imshow(cv2.cvtColor(original, cv2.COLOR_BGR2RGB))
    ax[0, 1].imshow(cv2.cvtColor(blur, cv2.COLOR_BGR2RGB))
    ax[1, 0].imshow(gray, "gray")
    ax[1, 1].imshow(binary1, "gray")
    ax[2, 0].imshow(open, "gray")
    ax[2, 1].imshow(dilate, "gray")

    # 标题
    ax[0, 0].set_title("original")
    ax[0, 1].set_title("image blur")
    ax[1, 0].set_title("image gray")
    ax[1, 1].set_title("image binary1")
    ax[2, 0].set_title("image open")
    ax[2, 1].set_title("image dilate")

    plt.show()

    f, ax = plt.subplots(3, 2, figsize=(12, 16))

    # 绘制子图
    ax[0, 0].imshow(dist, "gray")
    ax[0, 1].imshow(binary2, "gray")
    ax[1, 0].imshow(unknown, "gray")
    ax[1, 1].imshow(component, "gray")
    ax[2, 0].imshow(markers, "gray")
    ax[2, 1].imshow(cv2.cvtColor(result, cv2.COLOR_BGR2RGB))

    # 标题
    ax[0, 0].set_title("image distance")
    ax[0, 1].set_title("image binary2")
    ax[1, 0].set_title("image unknown")
    ax[1, 1].set_title("image component")
    ax[2, 0].set_title("image markers")
    ax[2, 1].set_title("result")

    plt.show()


if __name__ == "__main__":
    # 读取图片
    image = cv2.imread("coin.jpg")

    # 分水岭算法
    result = watershed(image)

    # 保存结果
    cv2.imwrite("result.jpg", result)
输出结果:


到此这篇关于OpenCV半小时掌握基本操作之分水岭算法的文章就介绍到这了,更多相关OpenCV分水岭算法内容请搜索hwidc以前的文章或继续浏览下面的相关文章希望大家以后多多支持hwidc!
【本文由:香港大带宽服务器提供】